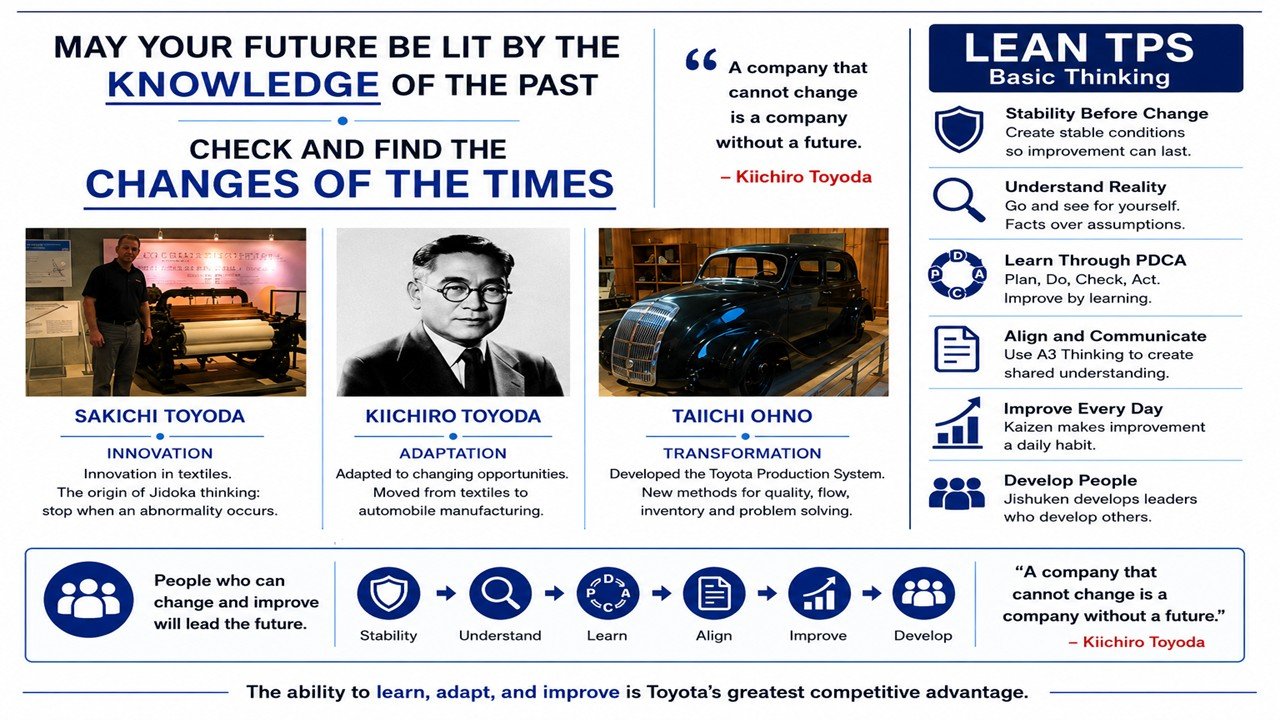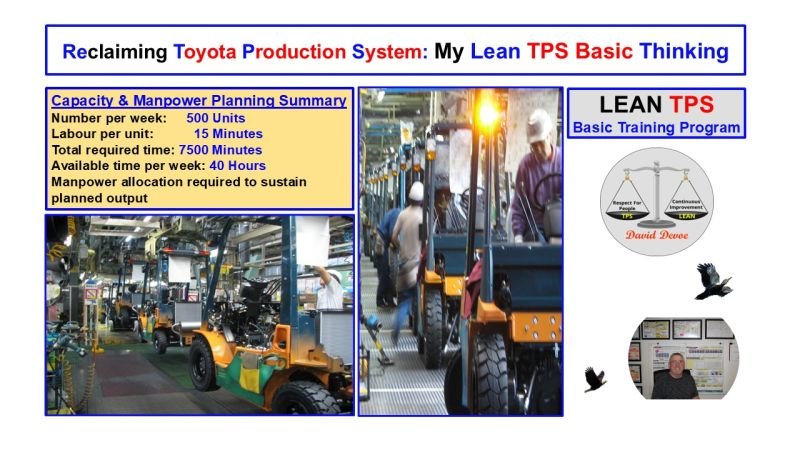
Reclaiming Toyota Production System: My Lean TPS Basic Thinking
Meeting production demand requires more than adding labor. It requires structured capacity planning grounded in Lean TPS principles. Toyota’s approach integrates manpower balance, standard work, and takt alignment to ensure production meets customer demand efficiently without overburdening people or processes.
This example demonstrates how to calculate manpower requirements, assess capacity, and balance workloads using Lean TPS logic.
Step 1: Determining Manpower Requirements
A work center is tasked with producing 500 forklifts per week, each requiring 15 minutes of labor. The total weekly labor demand is:
500 units × 15 minutes = 7,500 minutes (125 hours).
The work center operates 40 hours per week at 80% utilization and 110% efficiency. The rated capacity per assembler is therefore:
40 × 0.8 × 1.1 = 35.2 available hours per assembler.
To determine manpower:
125 total hours ÷ 35.2 available hours = 3.55 assemblers.
Since partial assignments are not possible, 4 assemblers are required to meet demand.
This ensures production stability without excessive overtime or underutilization.
Step 2: Assessing Actual Production Capacity
Once manpower is assigned, the next step is to evaluate the true production capacity.
4 assemblers × 40 hours per week = 160 total hours.
Applying utilization and efficiency:
160 × 0.8 × 1.1 = 140.8 available hours.
Converting to minutes:
140.8 × 60 = 8,448 minutes.
Each unit requires 15 minutes, so actual output capacity is:
8,448 ÷ 15 = 563 units per week.
This capacity exceeds the 500-unit requirement, providing flexibility to handle variation, rework, or unplanned downtime.
Step 3: Balancing the Work Center Load
Manpower planning is only part of the equation. Lean TPS emphasizes balance across all work centers to eliminate unevenness (Mura) and overburden (Muri).
Example – Weekly Load by Product Type
- Model A: Setup 3 hours, run time 2 hours per piece.
- Model B: Setup 5 hours, run time 1 hour per piece.
A three-week workload review reveals:
- Week 1 = 43 hours (3 hours over capacity)
- Week 2 = 38 hours (2 hours under capacity)
- Week 3 = 41 hours (1 hour over capacity)
Total = 122 hours, or 2 hours over capacity.
By identifying these imbalances, production planning can redistribute work, adjust setups, or improve sequence planning to maintain flow.
Step 4: Applying Lean TPS Thinking
Toyota’s manpower and capacity planning process is more than arithmetic. It is a visual, data-driven system that supports stability, flow, and people development. The focus is to:
- Balance workloads across shifts and lines.
- Maintain flexibility without creating excess labor.
- Improve methods before increasing manpower.
- Use Standardized Work to stabilize repetitive tasks.
The result is a system that meets customer demand while preventing overproduction, underutilization, and burnout.
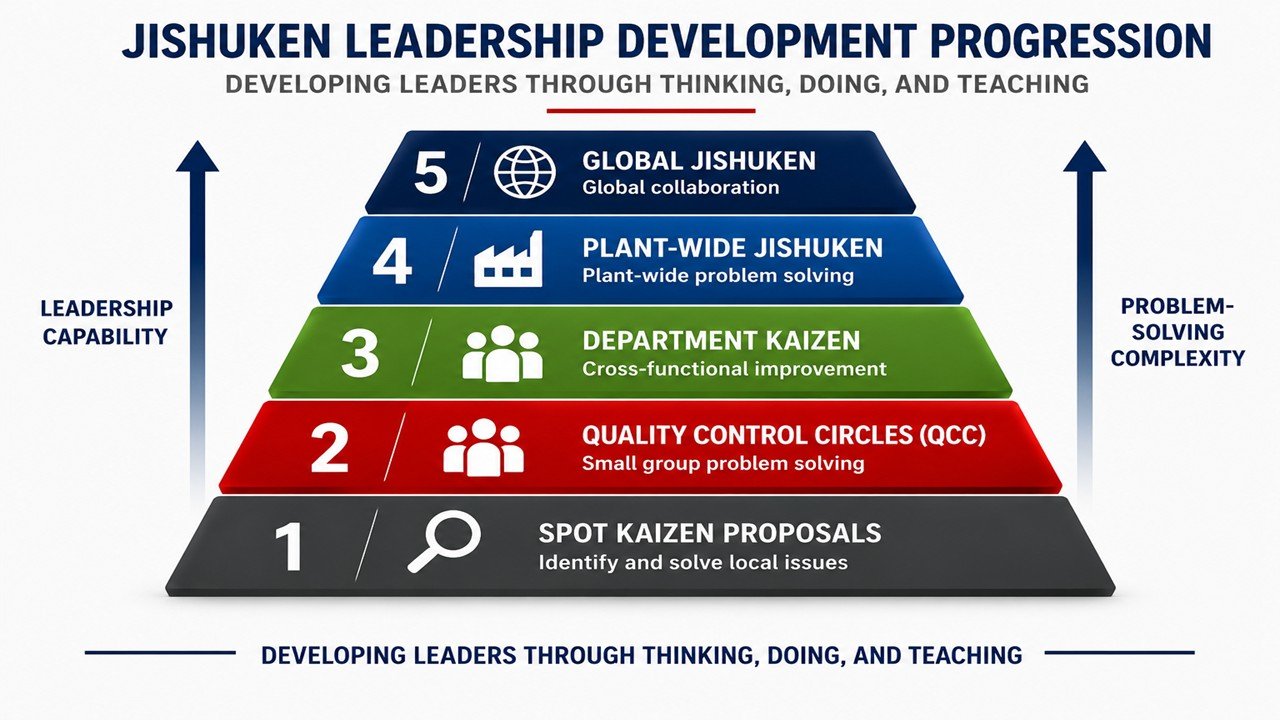
Lean TPS ensures that capacity planning supports both performance and respect for people. It aligns manpower, process capability, and continuous improvement into one consistent management system.