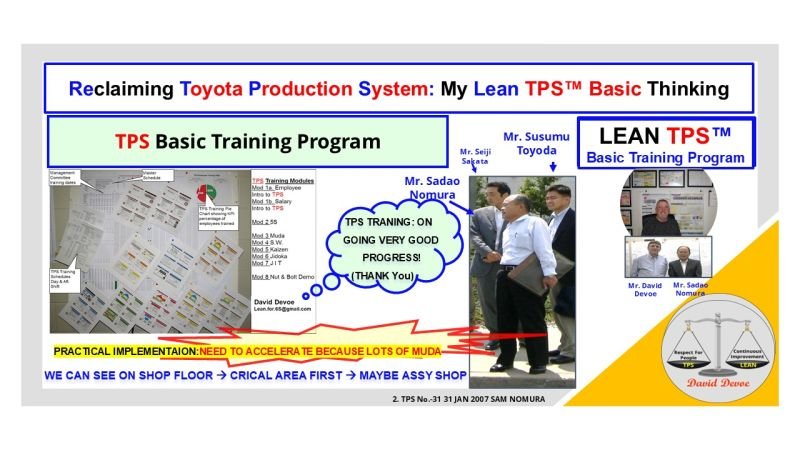
Reclaiming Toyota Production System: My Lean TPS Basic Thinking
Meeting customer demand requires more than meeting production numbers. It requires a system that connects manpower, time, and capacity into a predictable, repeatable process. Within the Toyota Production System, this is achieved through standardized calculations and structured observation that align available resources with customer requirements.
Toyota’s approach to manpower planning is not about maximizing output. It is about achieving balance. The correct number of people, properly trained and supported by clear standards, ensures flow, quality, and safety without waste. This example demonstrates how Lean TPS logic is applied to calculate manpower, analyze capacity, and correct imbalances before they affect performance.
Step 1: Defining the Problem
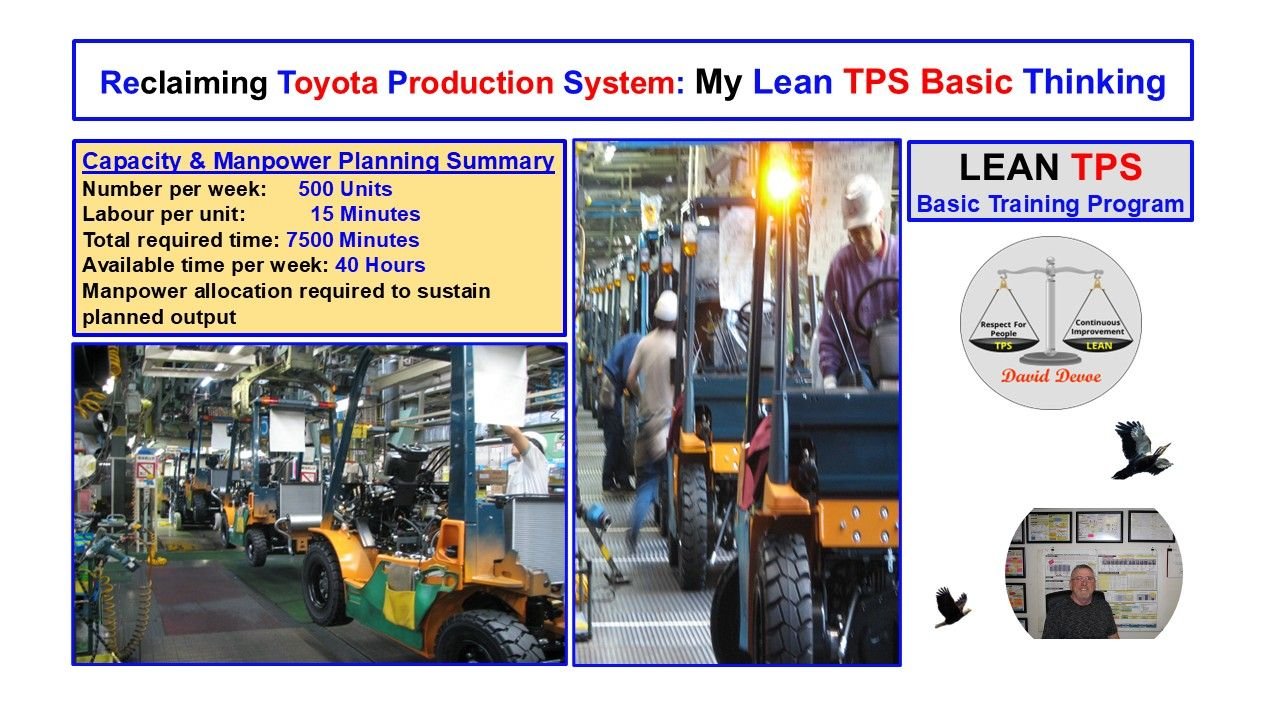
A work center must produce 500 forklifts per week. Each unit requires 15 minutes of direct labor to assemble. The work center operates 40 hours per week. The goal is to determine how many assemblers are required to meet weekly demand while considering efficiency and utilization factors that reflect real shop conditions.
Key information:
- Weekly volume: 500 units
- Labor time per unit: 15 minutes
- Available time per week: 40 hours per person
- Utilization: 80% (0.8)
- Efficiency: 110% (1.1)
Step 2: Converting Units and Establishing Totals
First, convert total labor time into a single comparable unit.
Each forklift requires 15 minutes of work. For 500 units:
500 units × 15 minutes = 7,500 minutes total labor required.
To express this in hours:
7,500 ÷ 60 = 125 total hours of work required per week.
This is the total time needed to assemble 500 forklifts.
Step 3: Calculating Effective Capacity per Assembler
Each assembler is scheduled for 40 hours per week, but not all time is directly productive. Breaks, meetings, material delays, and other interruptions reduce utilization. Efficiency reflects the team’s ability to complete work faster or slower than the standard time.
To calculate the effective available time per assembler, multiply scheduled hours by both factors:
40 hours × 0.8 utilization × 1.1 efficiency = 35.2 effective hours per assembler.
Each assembler contributes 35.2 hours of productive time per week.
Step 4: Determining Required Manpower
Now divide the total work required by the effective time available per person:
125 total hours ÷ 35.2 hours per assembler = 3.55 assemblers.
Because partial assignments are not practical, manpower is rounded up to 4 assemblers.
This number ensures that planned demand is met without overtime. In TPS logic, this is called capacity leveling, where people, equipment, and time are matched precisely to customer pull.
Step 5: Evaluating Actual Capacity
The next step checks whether the assigned manpower provides sufficient capacity.
Each assembler contributes 40 scheduled hours, for a total of:
4 assemblers × 40 hours = 160 total scheduled hours.
Applying the same utilization and efficiency factors:
160 × 0.8 × 1.1 = 140.8 effective hours per week.
Convert this to minutes:
140.8 × 60 = 8,448 minutes.
Each unit requires 15 minutes, so the team’s maximum weekly capacity is:
8,448 ÷ 15 = 563.2 units.
Rounded down, the team can produce 563 forklifts per week.
This capacity exceeds the required 500 units, providing a buffer of approximately 12.6 percent. The buffer covers variation in absenteeism, small stoppages, or unplanned downtime.
Step 6: Testing Sensitivity to Changes
TPS emphasizes understanding how small changes affect performance. By adjusting one variable at a time, leaders can visualize system sensitivity.
If efficiency drops from 110% to 100%, effective hours per assembler become:
40 × 0.8 × 1.0 = 32.0 hours.
Recalculate capacity:
4 assemblers × 32.0 = 128 effective hours.
128 × 60 = 7,680 minutes.
7,680 ÷ 15 = 512 units.
The system can still meet demand but with minimal margin.
If utilization decreases further to 70%, capacity falls below target:
40 × 0.7 × 1.0 = 28 hours per assembler.
4 assemblers × 28 = 112 hours total.
112 × 60 = 6,720 minutes.
6,720 ÷ 15 = 448 units.
This demonstrates that utilization has the strongest influence on throughput. Therefore, the leader’s focus should be on stabilizing processes and removing interruptions that reduce utilization.
Step 7: Balancing the Work Center
Once manpower is confirmed, the next requirement is to maintain even workload distribution. Toyota uses Yamazumi Charts and Standardized Work Combination Tables to visualize balance. When each assembler’s workload aligns closely with takt time, production flows smoothly.
For this example, the takt time is calculated as:
Available Time per Week ÷ Required Units = Takt Time.
(40 hours × 60 minutes) ÷ 500 = 4.8 minutes per unit.
This means one forklift should be completed every 4.8 minutes to meet demand.
If each assembler’s element work totals approximately 4.8 minutes, the line is balanced. If one station exceeds this, adjustments such as task redistribution, layout changes, or small kaizen improvements are implemented.
Step 8: Visual Management and Leadership Review
Toyota leaders use this data not only for planning but for teaching. By visually displaying required time, actual performance, and capacity margins, leaders can ask questions that develop thinking:
- What causes utilization loss in this process?
- How do we know the efficiency rating is accurate?
- What countermeasures prevent overburdening team members?
- How can we visualize capacity at the line level?
Through daily management, capacity planning becomes a learning system that develops both people and processes.
Step 9: Integrating Continuous Improvement
Once manpower and capacity are stable, kaizen activities focus on method improvement rather than output increase. Reducing process time through better tools, layout optimization, or motion analysis creates additional margin without increasing labor cost.
For example, if assembly time improves from 15 minutes to 14 minutes, total weekly time drops to:
500 × 14 = 7,000 minutes = 116.7 hours.
At 35.2 hours of available time per assembler, the requirement becomes:
116.7 ÷ 35.2 = 3.32 assemblers.
This demonstrates measurable benefit. Productivity increases by nearly 8 percent without overtime or additional staff.
Step 10: Lean TPS Interpretation
In the Toyota Production System, manpower and capacity planning are not accounting exercises. They are leadership tools for managing stability. Numbers make variation visible, but the purpose is to strengthen problem-solving capability.
Each formula reveals the relationship between demand, time, and people. When calculated, visualized, and reviewed daily, these relationships prevent waste and protect quality.
The result is not just accurate planning, but a workplace that learns continuously through disciplined observation.