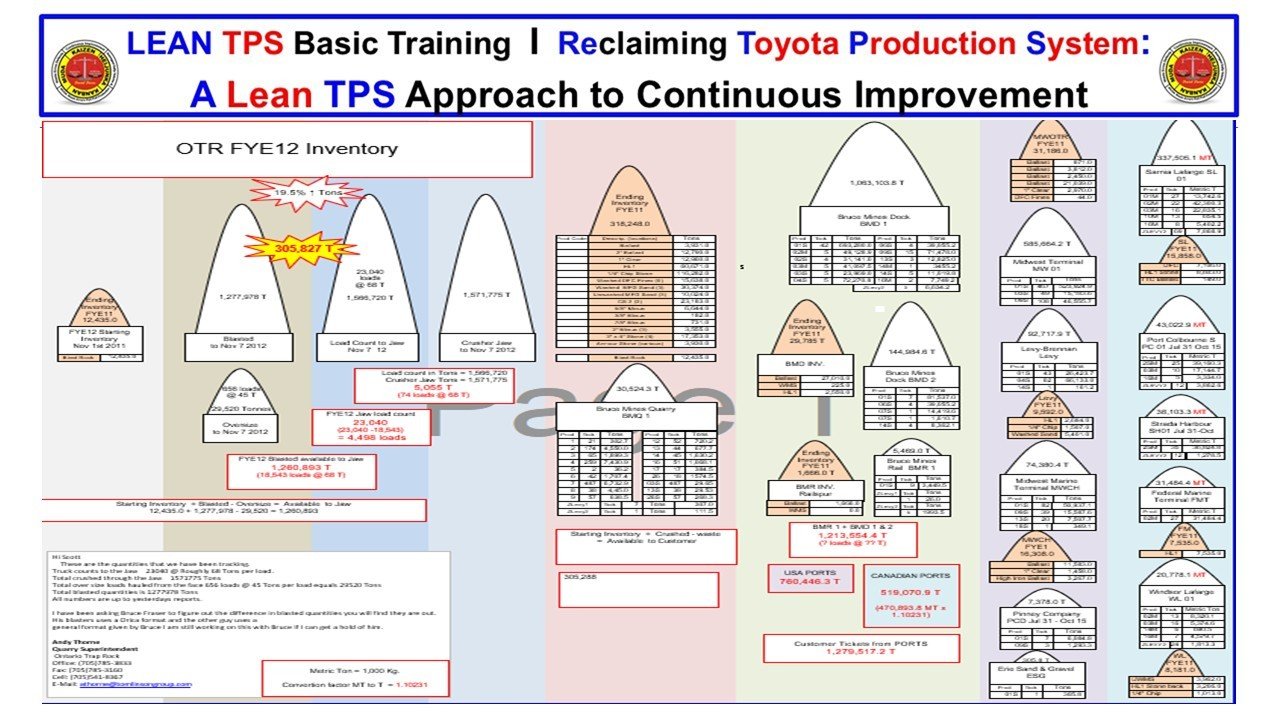
The A3 format is not limited to production lines. It is a way of thinking that applies anywhere flow and accuracy matter. This OTR FYE12 Inventory A3 demonstrates how Toyota-style visualization can clarify complex information in mining, logistics, and material management. The chart captures a complete year-end material flow for operations that move thousands of tons per day, showing how Lean TPS principles extend from shop floors to quarries and ports.
The background of this A3 tells the story of scale. The process involves multiple sites, including crushing operations, storage yards, marine terminals, and port facilities. Material moves through stages of blasting, loading, crushing, and shipping. Each triangle and box on the A3 represents both quantity and location, transforming a network of spreadsheets into one clear picture. This single-page view makes the total system visible.
At the center of the report is a focus on balance. The A3 highlights discrepancies between planned and actual inventory, measured in tons and loads. The visual shapes reveal flow imbalance and help managers identify where bottlenecks or overproduction occurred. What might take pages of text is shown here in seconds. Toyota calls this the power of visual control—turning data into a form that everyone can understand and act on.
The purpose of this inventory A3 is not just reconciliation. It is to teach how to see waste in information flow. By comparing inputs, outputs, and ending balances across each node of the process, the A3 reveals where resources were tied up, where waiting occurred, and where effort did not add value. This same logic drives Lean production but is applied here to logistics and resource management.
The structure of the report mirrors the PDCA cycle. The left side defines the current condition, listing quantities by stage and date. The center tracks actual versus standard flow, while the right side records total deliveries to customers and ports. Each section contains both raw data and derived insights. For example, the measured difference between mined, crushed, and loaded tons exposes the true system capability. By seeing these differences, teams can ask better questions: Where did the loss occur? What part of the process is constrained? Which data should be verified at the source?
The A3 format encourages fact-based dialogue. Instead of debating opinions, leaders and operators can stand around one sheet and point to evidence. This shared understanding builds accountability. It also reinforces a critical Lean lesson: visibility is the first step to control. Once a process can be seen, improvement can begin.
The results from this A3 were not only financial. It improved communication between field supervisors, logistics planners, and terminal managers. Each department could see how its performance affected the next stage. The A3 also provided a standard method for monthly reporting, making future audits faster and more reliable. More importantly, it became a teaching tool. New leaders learned how to interpret flow, recognize waste, and manage variation using real data.
This A3 Inventory Report stands as proof that Lean TPS thinking applies to every system of work. Whether the flow is of materials, people, or information, visualization connects cause to effect. When teams can see the total picture, they learn to act as one system instead of separate functions. That is the deeper meaning of Lean TPS.